
Drawdown in trading is a core risk measurement that defines the decline of a trading account from a previous high point before it recovers to a new peak. It is not a minor statistic. It is a structural measurement of risk exposure and capital vulnerability within a trading system.
Traders often concentrate on entry signals, indicators, or profit targets. However, drawdown represents the stress tolerance of both the account and the strategy. Without understanding drawdown, a trader cannot accurately assess performance quality, capital durability, or the sustainability of a trading method.
This document provides a structured definition of drawdown in trading, explains how drawdown is calculated, outlines its classifications, describes its causes, and clarifies its role across forex, stock, cryptocurrency, and commodity markets.
Definition of Drawdown in Trading
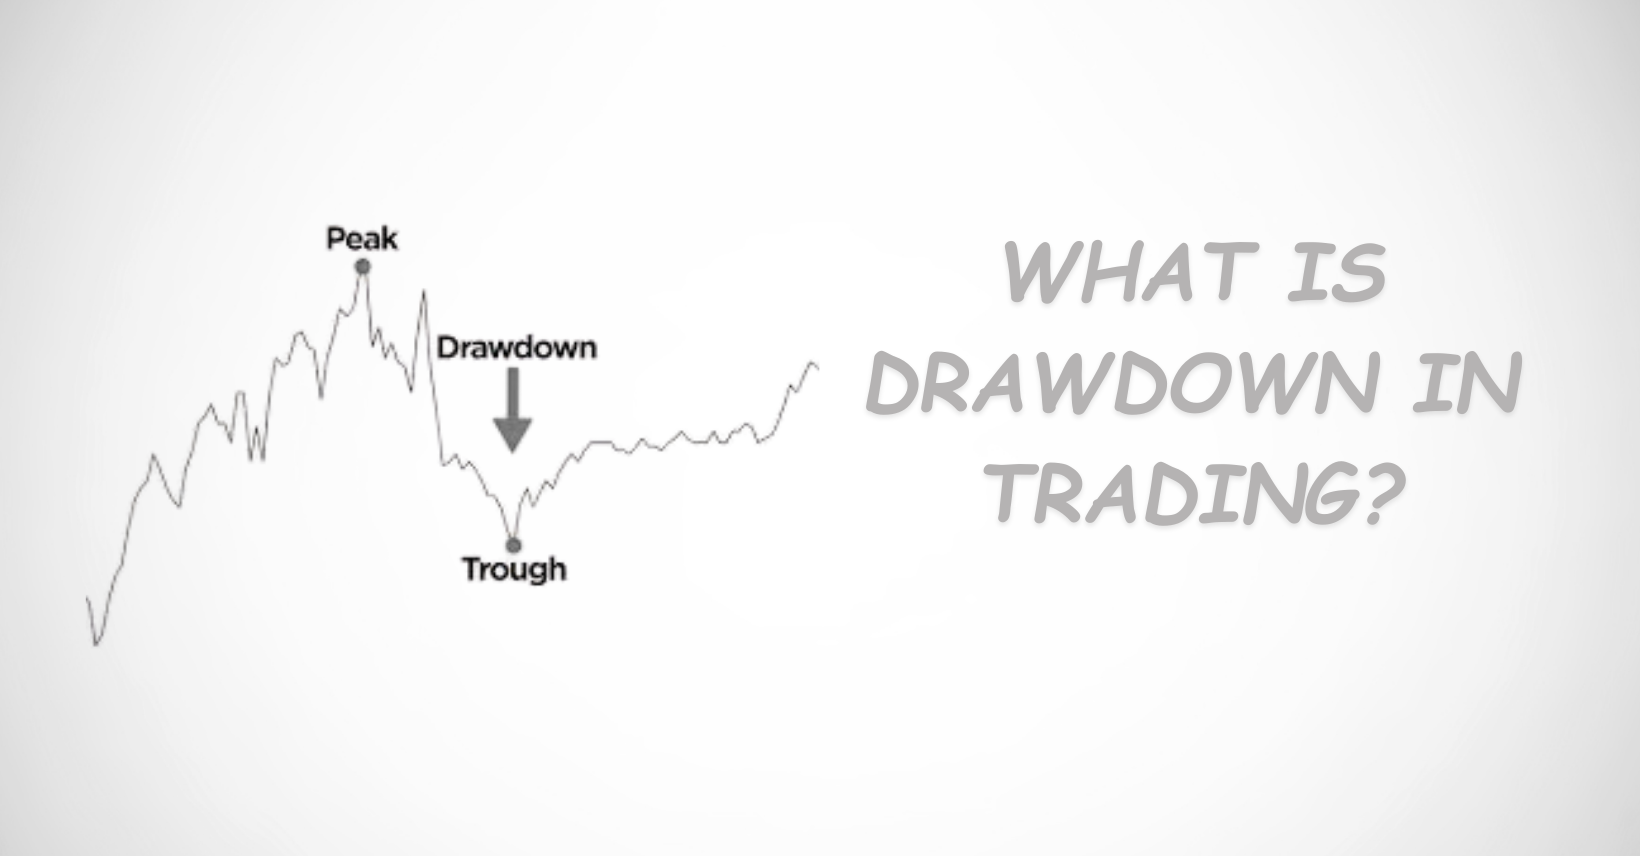
Drawdown in trading is defined as the reduction in account value measured from the highest recorded equity or balance level (peak) to the lowest subsequent value (trough) before a new peak is established.
In practical terms, drawdown quantifies the amount of capital lost from the highest point achieved prior to recovery.
Drawdown may be expressed as:
A percentage of account value
A monetary amount such as dollars or pesos
Points or pips depending on the instrument traded
Drawdown functions as a direct indicator of risk because it reveals the depth of decline experienced during adverse trading periods.
Meaning of Drawdown in Trading
The meaning of drawdown in trading refers to the temporary contraction of account equity during a losing sequence or unfavorable market phase.
A drawdown occurs whenever account value falls below its previous highest level.
Example:
An account increases from $1,000 to $1,500.
The account then declines to $1,200.
The drawdown is the decline from $1,500 to $1,200.
Although the account remains profitable relative to the original deposit, the drop from the peak represents a drawdown event. For this reason, drawdown is classified as a risk and performance metric rather than a simple profit and loss measurement.
Importance of Drawdown in Trading
Drawdown defines the stress threshold of a trading account and strategy.
A system may generate profits overall, yet if it experiences excessive drawdown, it may be impractical in live conditions. High drawdown can compromise capital stability and psychological discipline.
Drawdown directly influences:
Account survival probability
Capital preservation
Position sizing structure
Emotional control and behavioral stability
Recovery efficiency after losses
Reliability of backtesting results
Ignoring drawdown exposes a trader to elevated risk of account depletion, margin calls, or abandonment of a viable strategy due to pressure.
Difference Between Drawdown and Loss
A loss refers to a single negative trade outcome.
Drawdown refers to cumulative decline from an account’s peak value over time.
Example:
Account begins at $1,000
Account rises to $2,000
Account falls to $1,600
The trader remains profitable by $600 overall. However, the drawdown equals $400 because the account declined from its peak of $2,000.
Drawdown reflects worst-period decline, whereas a loss reflects one isolated trade result.
Calculation of Drawdown
Drawdown is calculated by measuring the difference between a peak account value and the lowest point reached before a new peak forms.
Formula:
Drawdown = Peak Value − Lowest Value
Percentage Drawdown = (Peak Value − Lowest Value) ÷ Peak Value × 100
This calculation applies to manual performance tracking as well as automated trading platform statistics.
Example of Drawdown Calculation
Account balance reaches $5,000 (peak). Account declines to $4,000 (trough). Account later rises to $5,500.
Dollar drawdown = $1,000 Percentage drawdown = 20%
The account experienced a 20 percent contraction before recovery.
Maximum Drawdown Definition
Maximum drawdown is defined as the largest peak-to-trough decline recorded during a specific evaluation period.
It represents the most severe historical decline experienced before recovery.
Maximum drawdown is widely used in:
Strategy backtesting
Proprietary firm evaluations
Portfolio allocation decisions
Automated trading system analysis
Investor performance reporting
A system with 40 percent maximum drawdown has historically lost 40 percent from a peak before recovering.
Types of Drawdown in Trading
Drawdown classifications vary based on measurement method.
The primary types include:
Balance drawdown
Equity drawdown
Floating drawdown
Relative drawdown
Absolute drawdown
Balance Drawdown Definition
Balance drawdown measures decline based solely on closed trades.
It excludes unrealized gains or losses from open positions. Balance drawdown changes only when trades are finalized. It reflects realized capital fluctuation but does not show current exposure during active positions.
Equity Drawdown Definition
Equity drawdown measures decline including both closed and open trades.
It represents real-time account performance. Equity drawdown incorporates floating losses and therefore provides a comprehensive risk picture. It is critical because unrealized losses may trigger margin calls or forced liquidation.
Floating Drawdown Definition
Floating drawdown refers specifically to unrealized losses from active positions.
It reflects temporary market exposure before trades are closed. Strategies that hold losing positions for extended periods often display substantial floating drawdown despite eventual profitability.
Relative Drawdown Definition
Relative drawdown expresses decline as a percentage relative to account size.
Example:
$500 decline on a $5,000 account equals 10 percent.
$500 decline on a $1,000 account equals 50 percent.
Percentage representation allows comparison between different account sizes or strategies.
Absolute Drawdown Definition
Absolute drawdown measures decline below the original starting deposit.
Example:
Initial deposit: $1,000
Lowest point reached: $700
Absolute drawdown equals $300.
This metric reflects capital exposure beneath the initial investment threshold.
Causes of Drawdown in Trading
Drawdown is inherent in trading activity due to probabilistic outcomes. However, excessive drawdown commonly results from structural weaknesses.
Primary causes include:
Ineffective risk control
Oversized position exposure
Extended losing sequences
Market condition shifts
High volatility environments
Liquidity contraction
Emotional overtrading
Absence of stop-loss discipline
Strategy fragility under non-ideal conditions
Drawdown intensifies when losses accumulate faster than gains recover them.
Drawdown and Risk Management
Risk per trade directly determines drawdown velocity.
A trader risking 10 percent per position will experience rapid equity contraction compared to one risking 1 percent.
Risk management components influencing drawdown:
Position size calibration
Stop-loss structure
Leverage moderation
Trade correlation awareness
Maximum daily or weekly loss limits
Capital preservation forms the structural base of sustained trading activity.
Impact of Drawdown on Performance
Drawdown severity affects required recovery percentage.
Recovery examples:
10 percent drawdown requires approximately 11 percent recovery.
20 percent drawdown requires 25 percent recovery.
50 percent drawdown requires 100 percent recovery.
70 percent drawdown requires 233 percent recovery.
As drawdown deepens, recovery difficulty increases exponentially.
Acceptable Drawdown Levels
Drawdown tolerance varies by strategy and risk preference.
General classifications:
0 to 10 percent: conservative
10 to 20 percent: moderate
20 to 30 percent: aggressive
Above 30 percent: high risk
Profitability combined with extreme drawdown suggests structural instability.
Drawdown in Forex Trading
Forex drawdown often expands due to leverage intensity and rapid price movement.
Contributing factors:
High leverage usage
News-driven volatility
Spread widening
Reversal exposure
Martingale or grid methodologies
Leverage magnifies decline speed and margin risk.
Drawdown in Stock Trading
Stock drawdown occurs when equity prices move adversely, particularly during earnings releases, market downturns, or sector rotations.
Influencing factors:
Sentiment shifts
Corporate announcements
Economic indicators
Interest rate adjustments
Index-wide corrections
Equity declines may persist for extended durations.
Drawdown in Cryptocurrency Trading
Cryptocurrency drawdown frequently reaches extreme levels due to volatility concentration.
Common drivers:
Liquidation cascades
Large holder activity
Regulatory announcements
Exchange disruptions
High futures leverage
Volatility amplifies both profit potential and contraction risk.
Psychological Dimension of Drawdown
Drawdown produces psychological strain beyond financial reduction.
Common behavioral reactions:
Strategy doubt
Rule violations
Increased risk-taking
Impulsive entries
Premature exits
Avoidance of valid setups
Psychological resilience is required to maintain consistency during contraction phases.
Drawdown in Strategy Evaluation
Strategy assessment must incorporate drawdown analysis.
Key evaluation characteristics:
Smooth equity progression
Controlled maximum drawdown
Balanced risk-to-reward structure
Reasonable recovery duration
Adaptability across varying conditions
Profit without risk control lacks structural durability.
Drawdown Versus Volatility
Volatility measures market price fluctuation magnitude.
Drawdown measures account equity contraction.
High volatility does not automatically produce high drawdown if position size is controlled. Conversely, poor risk allocation can generate high drawdown even in stable markets.
Drawdown Reduction Methods
Drawdown mitigation methods include:
Low percentage risk per trade
Consistent stop-loss application
Moderated leverage
Limited concurrent exposure
Avoidance of correlated positions
Disciplined trade selection
Emotional control
Defined loss ceilings
Liquidity awareness
Avoidance of unpredictable news exposure
Drawdown cannot be eliminated, only constrained.
Drawdown and Leverage Relationship
Leverage multiplies both exposure and decline speed.
Excessive leverage frequently results in:
Accelerated equity erosion
Margin calls
Forced liquidation
Heightened emotional stress
Controlled leverage is essential for structural stability.
Drawdown and Stop-Loss Structure
Stop-loss placement influences drawdown magnitude.
Excessively tight stops may produce repeated minor losses. Excessively wide stops may allow disproportionate decline.
Optimal practice aligns stop placement with market structure and adjusts position size accordingly.
Drawdown and Recovery Duration
Drawdown severity includes both depth and recovery time.
Shorter recovery periods reduce psychological burden and capital stagnation. Extended recovery intervals may weaken discipline and confidence.
Evaluation should include maximum drawdown and time-to-recovery metrics.
Normalcy of Drawdown
Drawdown is an inherent component of probabilistic trading systems.
No strategy operates without contraction phases. Risk arises when drawdown exceeds controlled thresholds or stems from poor structural decisions.
Long-term sustainability depends on keeping drawdown within acceptable boundaries.
Comprehensive Definition Summary
Drawdown in trading is the measurable decline of account value from a peak to a trough before recovery.
It functions as a central risk metric, reflecting capital exposure during adverse periods.
Drawdown classifications include balance, equity, floating, relative, absolute, and maximum drawdown.
Understanding drawdown allows structured performance evaluation, disciplined risk control, and long-term trading consistency.
Trading success is defined not solely by profit magnitude but by the relationship between return and drawdown.
Professional trading practice requires systematic drawdown management as a foundational principle of capital preservation.
